Currently, approximately 19.1 million students attend U.S. colleges and universities. Female students represent 58% of undergraduate enrollment, while males account for 42%.
This article examines current enrollment statistics, demographic patterns, institution types, geographic distribution, and future projections for higher education.
College Enrollment Statistics: Key Takeaways
- Spring 2025 saw 3.2% growth after pandemic declines.
- Two-year institutions experienced a notable 6.3% enrollment increase.
- Black and multiracial students showed the largest enrollment gains.
- Graduate programs grew 1.5%, reaching 7.2 million students.
- Female students’ enrollment margins are higher than those of males.
How Many Students Enroll In College?
According to the National Student Clearinghouse Research Center Spring 2025 Current-Term Enrollment Estimates, total U.S. postsecondary enrollment rose by 3.2% (+562,000 students) compared to Spring 2024.
Undergraduates totaled 15.3 million (+3.5%), while graduate enrollment reached 7.2 million (+1.5%).
Associate degrees saw a notable 6.3% boost, and bachelor’s programs grew by 2.1%, though both remain slightly below Spring 2020 levels.
College Enrollment Trends
College enrollment shows steady recovery post-pandemic, driven by undergraduates, vocational-focused programs, and demographic shifts toward diverse, older learners, reflecting a complex landscape of growth and change.
- Undergraduate growth: Spring 2025 undergrad enrollment increased 3.5%, totaling 15.3 M, though still 2.4% below Spring 2020 levels.
- Graduate rise: Graduate students reached 7.2 M, up 1.5% year-over-year and 7.2% above Spring 2020.
- Vocational surge: Public two-year vocational/trade programs grew 20% since Spring 2020, boosting community college enrollment.
- Public four‑year growth: These institutions added 183,000 students (+2.5%) in Spring 2025, reaching over 7.4 M.
- Certificate gains: Undergraduate certificate program enrollment rose 4.8%, now 20% above 2020 levels. Many students pursue Google certificates in addition to traditional degrees to enhance their career prospects.
- Demographic upturn: Black and multiracial undergrad enrollments surged 10.3% and 8.5%, the largest increases among groups.
- Fall rebound: Fall 2023 postsecondary enrollment increased 2.5%, the first growth in over a decade, led by four-year institutions
Sources: Studentclearinghouse, NSC Research Center
In addition to college enrollment, the e-learning market is experiencing broader growth, projected to reach $325 billion by 2025.
College Credential Types
According to the NSC research center, the following are the types of college credentials.
- Certificate Programs: Undergraduate certificate program enrollment grew for the fourth consecutive year, up 9.9 percent in fall 2024 (+101,000).
- Associate Degrees: associate degree programs also increased (+6.3%).
- Bachelor’s Programs: Bachelor’s degree programs also increased (+2.9%).
U.S. College Enrollment: Public Vs Private Institutions
Public institutions consistently dominate college enrollment, serving approximately three-quarters of all students. Many colleges provide scholarships for college students to help manage rising educational costs and improve accessibility across different economic backgrounds.
| Year | Public Colleges | Private Colleges | Status |
|---|---|---|---|
| 2019 | 14,503,647 | 5,126,531 | Actual |
| 2020 | 13,884,456 | 5,142,954 | Actual |
| 2021 | 13,543,524 | 5,116,327 | Actual |
| 2022 | 13,863,775 | 5,097,506 | Actual (provisional) |
| 2023 | 13,861,062 | 5,078,507 | Actual (provisional) |
| 2024 | 14,087,874 | 5,159,765 | Projected |
| 2025 | 14,318,451 | 5,249,241 | Projected |
Source: NCES
The public sector consistently enrolls roughly three‑quarters of all U.S. college students.
After a pandemic‑era low in 2021, both sectors are projected to rebound modestly through 2025.
Private‑college totals remained comparatively stable even when public‑college enrollment dipped in 2020‑21.
College Enrollment By Various Factors
Enrollment varies significantly across institution types, demographics, geography, student age, and degree level, reflecting broad diversification in who attends college.
College Enrollments By Institution
Most U.S. undergraduates attend public institutions. In Fall 2021, roughly 15.4 million undergrads were enrolled nationwide.
Of these, about 48% attended public 4‑year colleges, 29% attended public 2‑year schools, and 17% attended private nonprofit 4‑year schools.
The remaining ~5% were at private for-profit or other institutions. The table below converts these shares into approximate enrollment counts (Fall 2021):
| Institution Sector | Enrollment (millions) |
|---|---|
| Public 4-year institutions | 7.4 |
| Public 2-year institutions | 4.5 |
| Private nonprofit 4-year | 2.6 |
| Other (for-profit/other)** | 0.8 |
| Total undergraduates (Fall 2021) | 15.4 |
Source: NCES (Fall 2021). “Other” includes private for-profit and 2‑year nonprofit institutions (~5%).
College Enrollments By State
Enrollment totals vary widely by state. With approximately 115,171 schools across all education levels in the United States, these enrollment patterns reflect regional population density and educational infrastructure.
The table below lists enrollment for the five largest states:
| State | Enrollment (approx.) |
|---|---|
| California | 2,486,788 |
| Texas | 1,567,017 |
| New York | 1,117,623 |
| Florida | 999,223 |
| Illinois | 677,446 |
All figures are approximate, based on recent U.S. totals.
Source: State enrollment data (Fall 2019/2020)
College Enrollments By Year
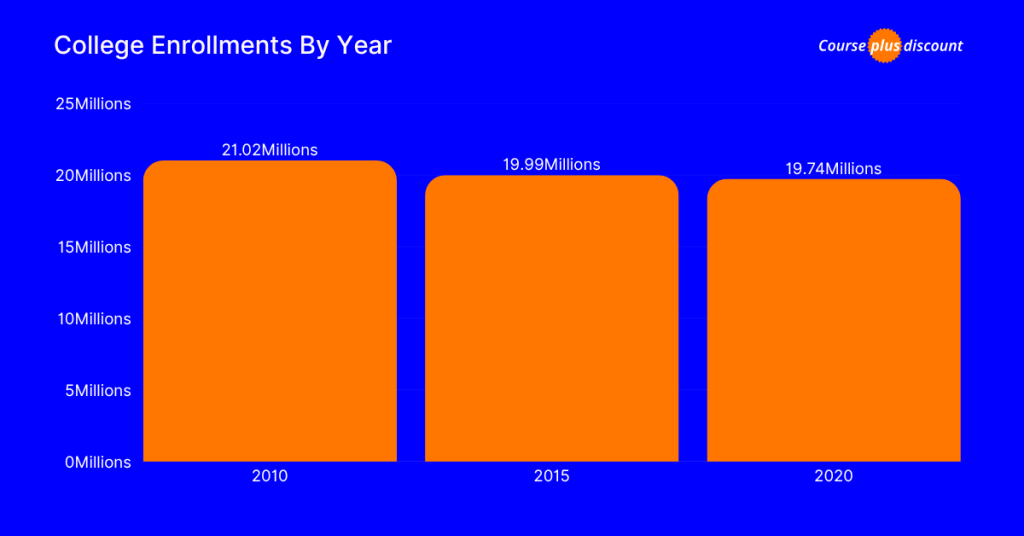
Total U.S. postsecondary enrollment has fluctuated in recent decades. Degree-granting enrollments peaked around 2010 and declined thereafter.

The table below summarizes total degree-granting enrollment (all students, public + private) at selected years:
| Year | Total Enrollment (millions) |
|---|---|
| 2010 | 21.02 |
| 2015 | 19.99 |
| 2020 | 19.74 |
On average, total Fall enrollment was about 21.0 million in 2010, 20.0 million in 2015, and 19.74 million in 2020, as per the NCES digest table.
College Enrollments By Age: Demographics

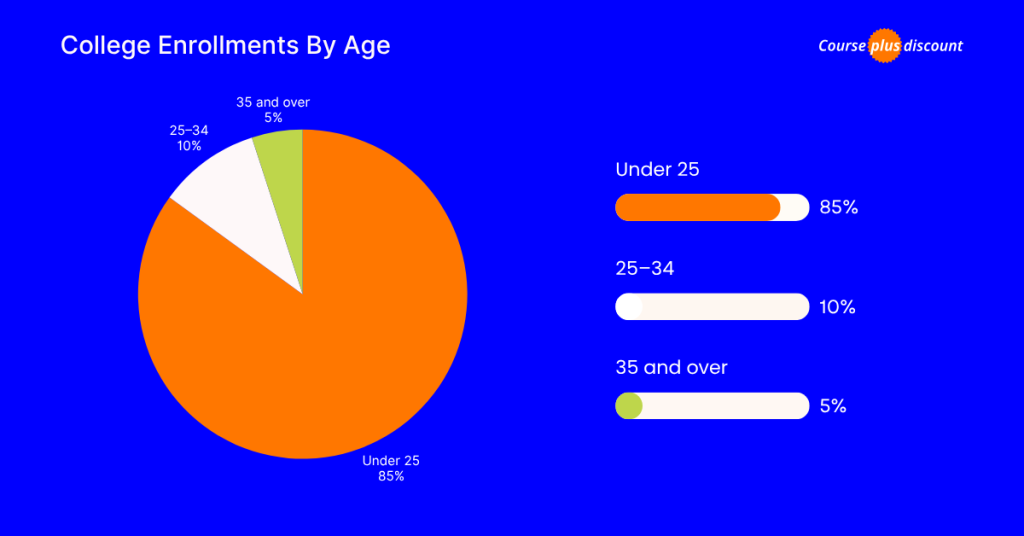
The undergraduate population skews young. The table below shows the shares of full-time undergrads:
| Age Group | Share of Full-Time UG Enrollment (%) |
|---|---|
| Under 25 | 85% |
| 25–34 | 10% |
| 35 and over | 5% |
Source: NCES (Fall 2021 IPEDS)
College Enrollments By Sex: Male And Female
In Fall 2021, 58% of undergraduates were female (8.9 million), while 42% were male (6.5 million), marking a sustained gender gap in college enrollment.
| Sex | Undergraduate Enrollment |
|---|---|
| Female | 8.9 million (58%) |
| Male | 6.5 million (42%) |
| Undergrad (2024 est.) – Female | 8.7 M |
| Undergrad (2024 est.) – Male | 6.4 M |
Source: Statista, NCES Digest
College Enrollments By Degree
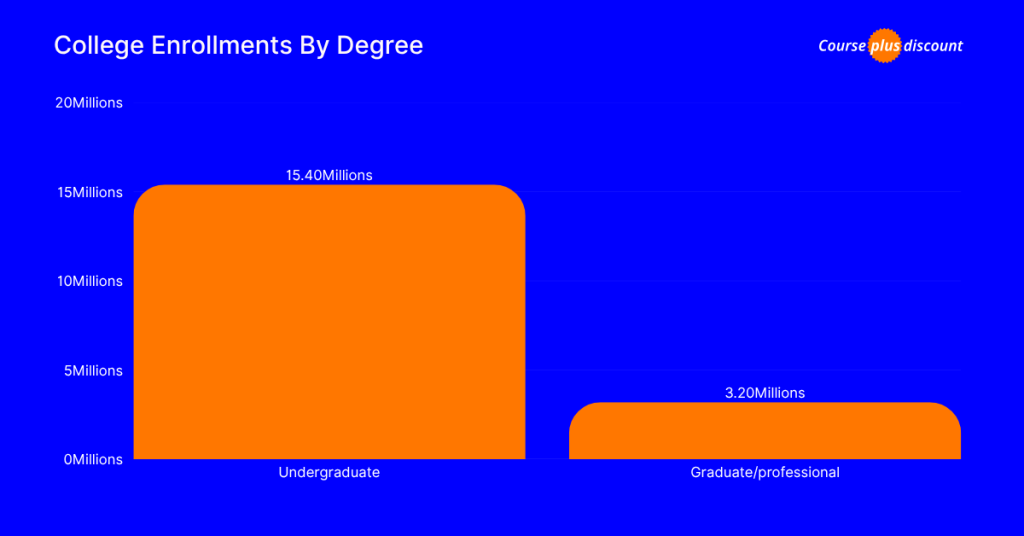
In 2021, there were about 15.4 million undergraduates and 3.2 million graduate/professional students enrolled in U.S. degree-granting institutions.

The table below summarizes by broad degree level:
| Level of Study | Enrollment (millions) |
|---|---|
| Undergraduate | 15.4 |
| Graduate/professional | 3.2 |
Source: NCES (Fall 2021)
College Enrollments By University
A few U.S. colleges enroll exceptionally large student bodies. The largest campuses in Fall 2020 were:
- Western Governors University (UT): 147,866 students
- Southern New Hampshire University (NH): 134,345 enrollments
- Grand Canyon University (AZ): 103,427 enrollments
- Liberty University (VA): 93,349 students
- Penn State University (PA): 89,816 enrollments
Sources: U.S. Dept. of Education, National Center for Education Statistics (NCES) and National Student Clearinghouse. Statistics for U.S. institutions only.
College Admission And Application Trends Statistics 2025
First-year college applications reached 8.3 million in the 2024-25 academic year, reflecting continued growth despite the demographic challenges facing higher education institutions nationwide.
| Metric (first‑year applicants) | 2023‑24 cycle (final) | 2024‑25 cycle† | First rise since 2021‑22 |
|---|---|---|---|
| Distinct applicants | 1,303,576 | 1,358,794 | + 4 % |
| Total applications | 7,840,232 | 8,289,409 | + 6 % |
| Avg. apps / applicant | 6.01 | 6.10 | + 1 % |
| Early‑Action applications | – | + 17 % vs. 2023‑24 | n/a |
| Early‑Decision applications | – | + 4 % vs. 2023‑24 | n/a |
| Applications to public members | baseline | + 10 % YOY | Outpacing private |
| Applications to private members | baseline | + 2 % YOY | – |
| Test‑score reporters | – | 659,385 (reporters) vs. 699,409 (non‑reporters); reporters + 11 % YOY | first rise since 2021‑22 |
| URM applicants | – | + 12 % YOY; Latinx +13 %, Black +10 % | Diversification continues |
| First‑generation applicants | – | + 13 % YOY | Growth outpaces peers |
| Avg. acceptance rate (4‑yr colleges, latest)* | – | 72.6 % (Fall 2022) | Public 78 %, private 70 % |
Sources: Common App, NACACNET
College Enrollment Future Projections
According to the NCES Projections of Education Statistics, U.S. college enrollment in degree-granting institutions is set to rebound after recent declines.
Total enrollment dropped from 21 million in 2010 to around 19 million in 2020, but by Fall 2030, it’s expected to rise 8%, reaching about 20.5 million students.
| Race/Ethnicity | 2020 Enrollment | 2030 Projected | Change |
|---|---|---|---|
| American Indian/Alaska Native | 121,000 | 125,000 | +3% |
| Asian/Pacific Islander | 1,400,000 | 1,302,000 | –7% |
| Black | 2,400,000 | 2,856,000 | +19% |
| Hispanic | 3,700,000 | 4,477,000 | +21% |
| White | 9,800,000 | 10,094,000 | +3% |
| Two or more races | 762,000 | 794,000 | +4% |
Hispanic students will benefit significantly from initiatives like the Hispanic Scholarship Fund, which annually selects 10,000 scholars for scholarships ranging from $500 to $5,000.
Public college enrollment is projected to climb 9%, from 13.9 million in 2020 to approximately 15.1 million by 2030, while private institutions should see a 5% increase to about 5.4 million.
Overall, these trends suggest steady future growth in higher education participation.
Conclusion: College Enrollment Grew 3.2% After COVID
College enrollment statistics reveal a recovering higher education sector with 19.1 million students enrolled annually across U.S. institutions.
Recent growth in vocational programs, certificate courses, and diverse student populations indicates changing educational preferences.
Demographic shifts show increases among Black, Hispanic, and multiracial students, supporting equity goals. However, by 2030, it is expected that around 20.5 million students will be enrolled in college, depending on demographic changes and institutional developments.
FAQs
Western Governors University in Utah leads with 147,866 students, followed by Southern New Hampshire University.
Gen Z shows mixed patterns with some declining traditional enrollment but increasing vocational program participation.
Financial concerns and rising tuition costs remain the primary barriers preventing college enrollment nationwide.
Webb Institute in New York has among the smallest enrollments, along with College of the Atlantic, Sweet Briar College, Eureka College, Lyon College, Hampshire College, LaGrange College, and Whittier College.
In 2025, it is estimated that approximately 19.57 million students will enroll in undergraduate programs annually across U.S. colleges and universities.
